Today, let’s have a look at four great graphs which indicate the trends shaping the evolution of our food value chain in the short, medium and long term.
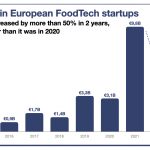
Short-term: Plant-based sales actually grew a bit in Europe in 2022
I must admit that this GFI’s report and findings came as a surprise. Indeed, we are used to hearing that plant-based sales are declining or stalling at best. The report shows that plant-based sales (in €) grew by 49% in 2021 and 20% in 2022.
But… this growth may be partly an illusion as 2022’s growth equals Europe’s food inflation level (+19% year over year).
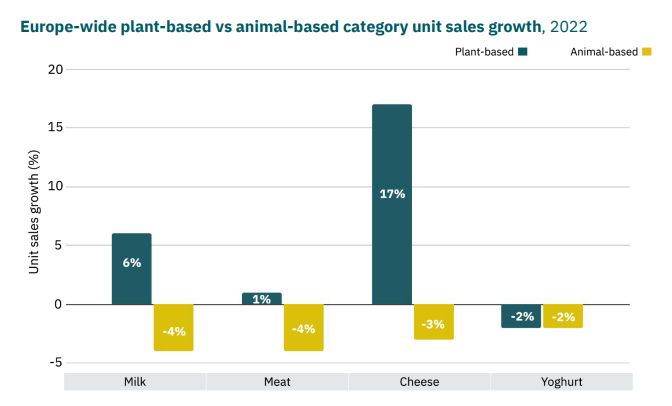
As you can see in the evolution in terms of volume, the main categories have had a very small increase. On the positive side, we can see that this small increase is still much better than the decline (in volume) in the sales of animal-based products.
Access GFI Europe report here. It is full of insights.
Medium-term: what is natural?
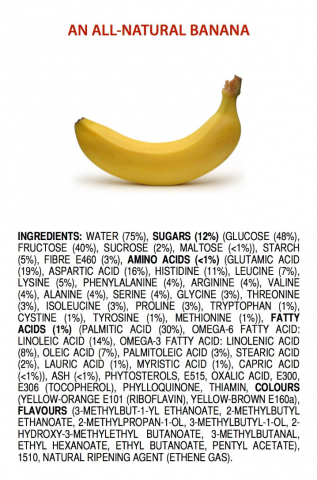
This infographic (from Linkedin) is an answer to the current debate about the naturalness of food.
We don’t necessarily agree with the idea of foods being the sum of their components, but it is a great way to question our vision of “what is natural”:
- In Italy, the government plans to preemptively ban cellular agriculture to defend tradition
- Many people are influenced by lobbies defending meat or dairy as more natural than future food, such as precision fermentation alternatives
However, the food items we commonly use today have been heavily modified during the past centuries (notably in the past decades). They have very little in common with how they were shaped by “nature”.
Beyond the infographic, I think opening a debate on what is natural and the benefits of “naturalness” for our health and the planet should be a priority. Indeed, let’s take a very simple example. What is more natural and what is best between:
- “real” meat coming from an animal, for instance, a chicken which has been selected to grow huge amounts of meat at an incredible speed.
- “fake” meat made from plants, with natural but often processed ingredients
- “lab-grown” meat made from cells
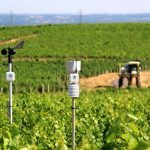
Long-term: the impact of climate on livestock
We often discuss the impact of food on climate change, but we often forget how the already foreseeable changes will impact our food system. This is notably the case for crop yields but also for livestock: heat waves will have a significant effect on this activity.
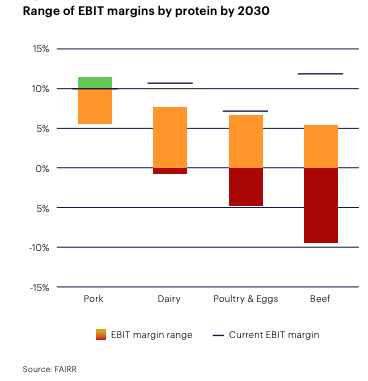
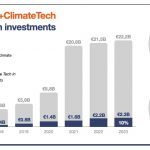
A new report by FAIRR attempts to see what will be the financial impact of climate cha
nge on the livestock sector. On the opposite graph, you can
see the current profitability of animal protein companies (black lines) by type of product. In colour is the impact of climate change (both direct and indirect with regulation) depending on the scenario (1.5C in green, 2.0C in orange, above 2.0C in red).
The profitability of the livestock sector would be severely compromised in extreme scenarios, which would probably lead to high prices of carbon.
As shown in the graphs above, we are just entering a phase of fast evolution of our food system. Some adjustments to what we consider natural and desirable may be required to adapt to upcoming changes.